NHL analytics ยท built from the public play by play feed

Pull the Goalie Sooner?

Every NHL coach who trails late has to decide when the goalie comes out. I tracked every pull in 6,762 games since 2021 and built a model of the last ten minutes. The answer is yes, and by a lot.

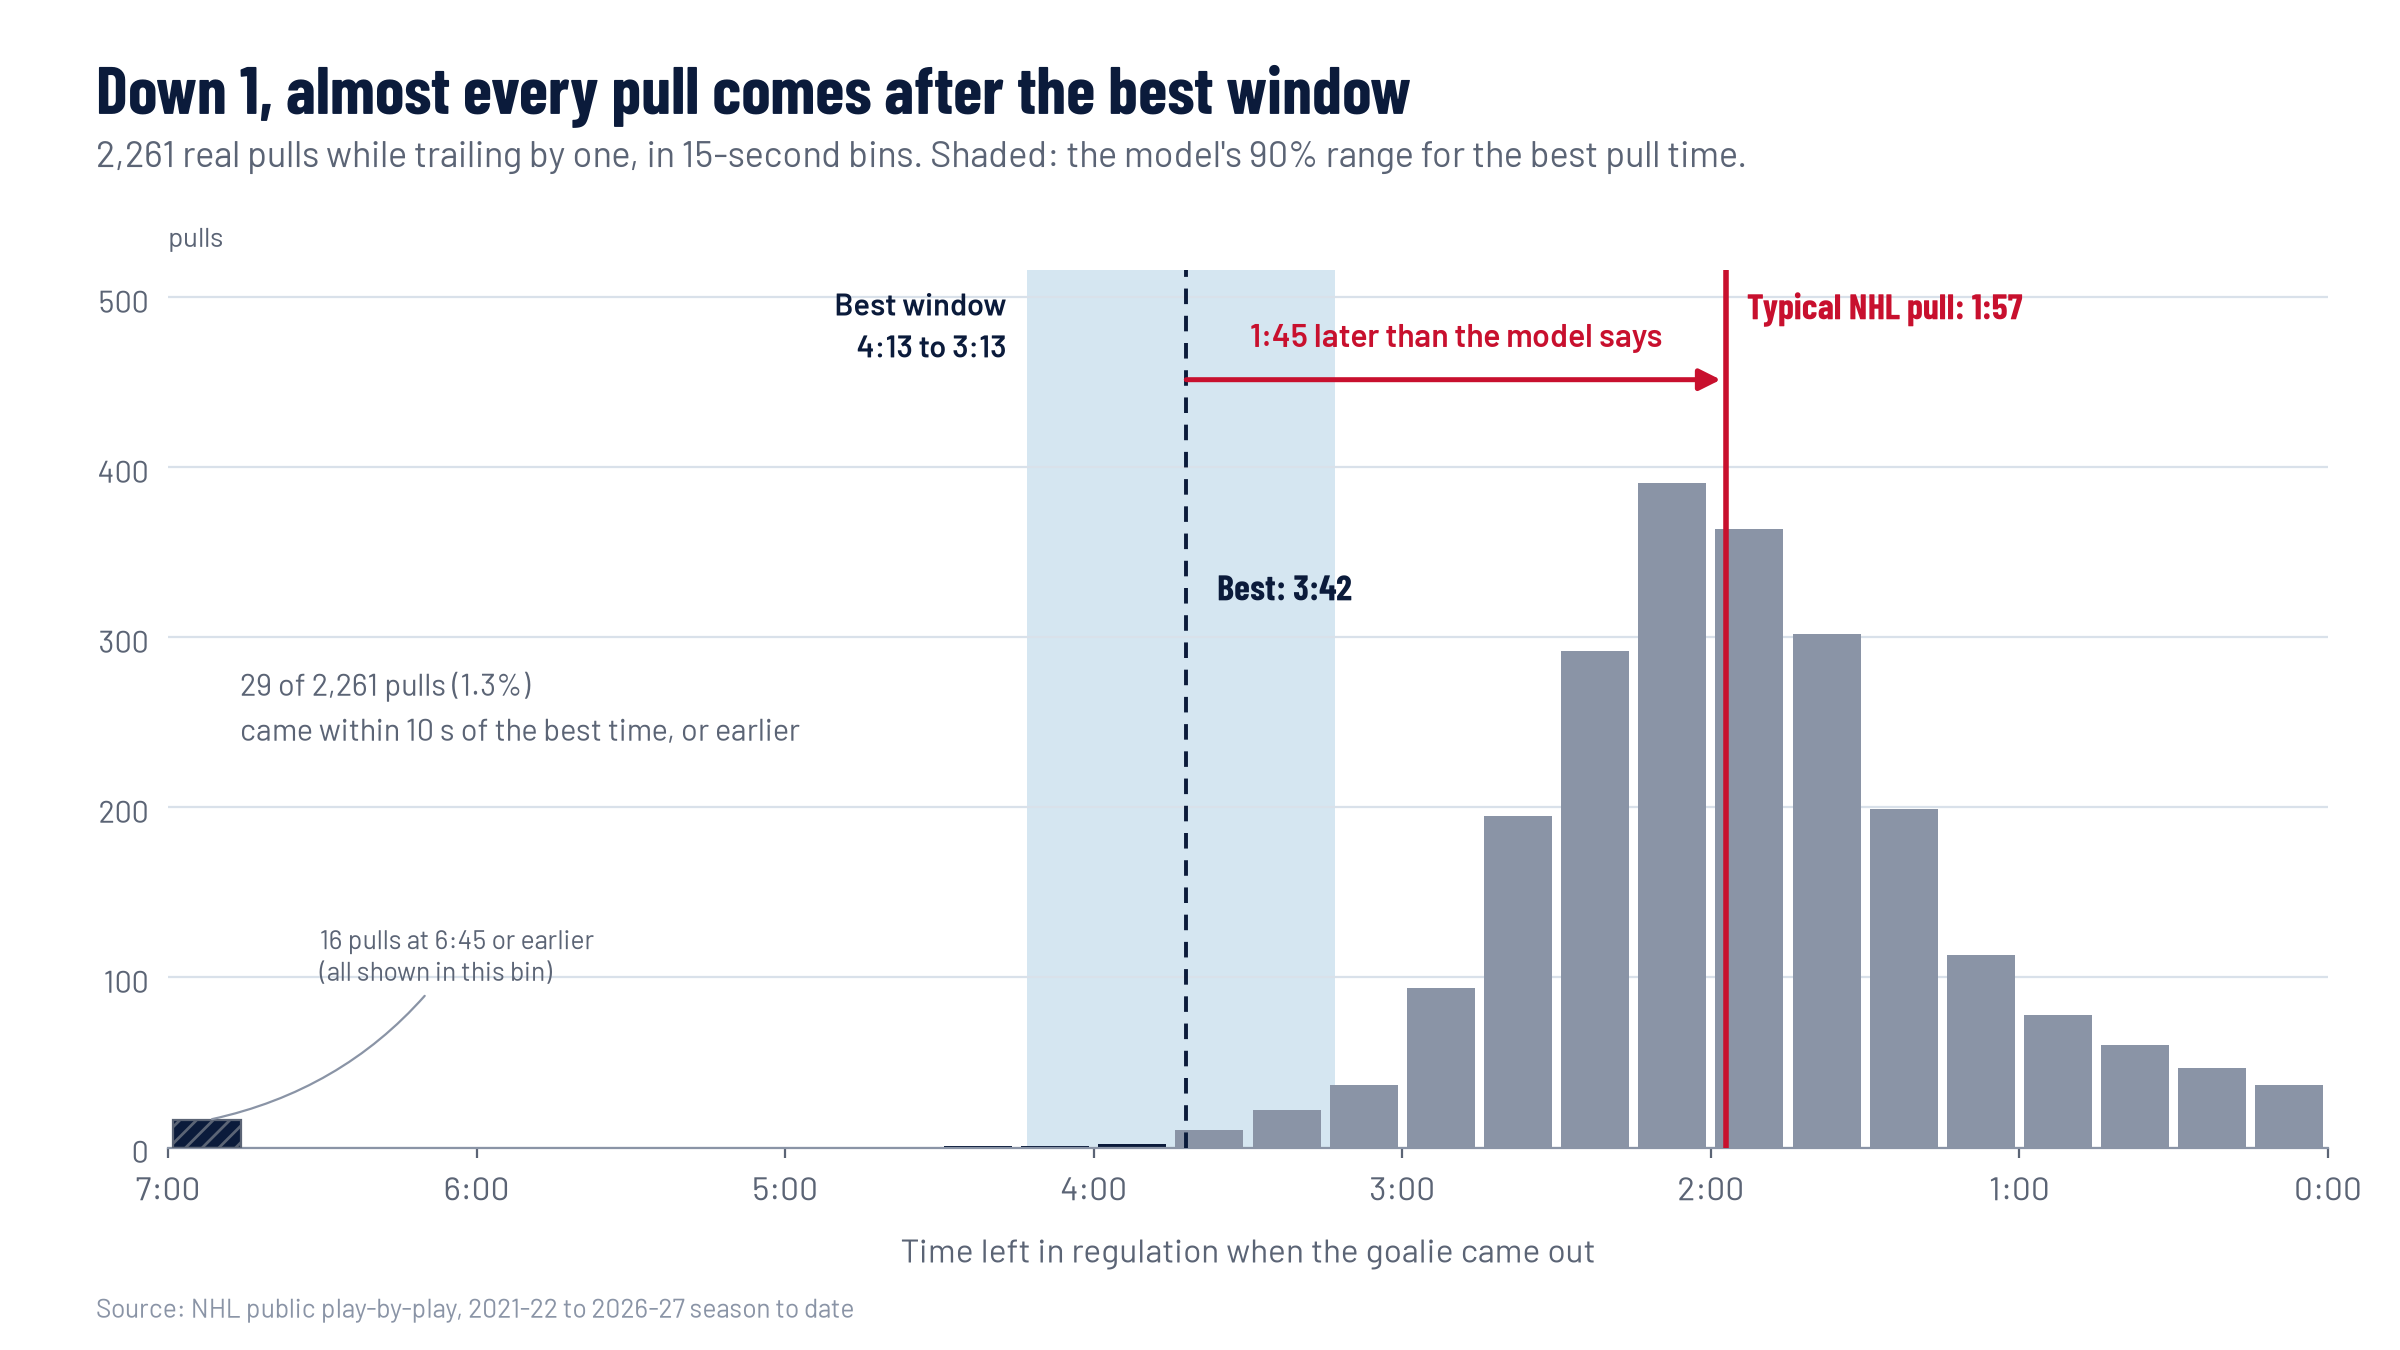
Histogram of 2,261 NHL goalie pulls while trailing by one goal, 2021-22 onward, on a game clock from 7:00 to 0:00. The model's best window, 4:13 to 3:13 left with the best time at 3:42, is shaded and almost empty. The pulls pile up around the typical NHL pull at 1:57, 1:45 later. 29 pulls, about 1.3 percent, came within 10 seconds of the best time, or earlier.
Every goalie pull while trailing by one since 2021-22, against the model's best window.
3:42
best time to pull when down 1
NHL median: 1:57
6:21
best time to pull when down 2
NHL median: 3:03
13
standings points the league leaves on the ice every season
98% of it from waiting too long
1%
of pulls while down 1 come within 10 seconds of the best time, or earlier
across 2,261 real pulls

The bench tool

Pick a game state. The model tells you whether to pull now or how long to wait, and what each choice is worth.

WAIT
Pull right now
Pull at the best time
Pull at the NHL median time
Expected result from this moment for every possible pull time. Higher is better.

What six seasons of pulls say

Histogram of 2,261 NHL goalie pulls while trailing by one, on a game clock from 7:00 to 0:00. The model's best window, 4:13 to 3:13 left, is shaded and nearly empty; the typical pull comes at 1:57, 1:45 after the best time of 3:42. 29 pulls (1.3%) came within 10 seconds of the best time, or earlier. The last bar on the left holds every pull at 6:45 or earlier.
When down 1, the typical NHL pull comes about 1:45 later than the model's best time. The blue band is the 90% range once you account for uncertainty in the goal rates.
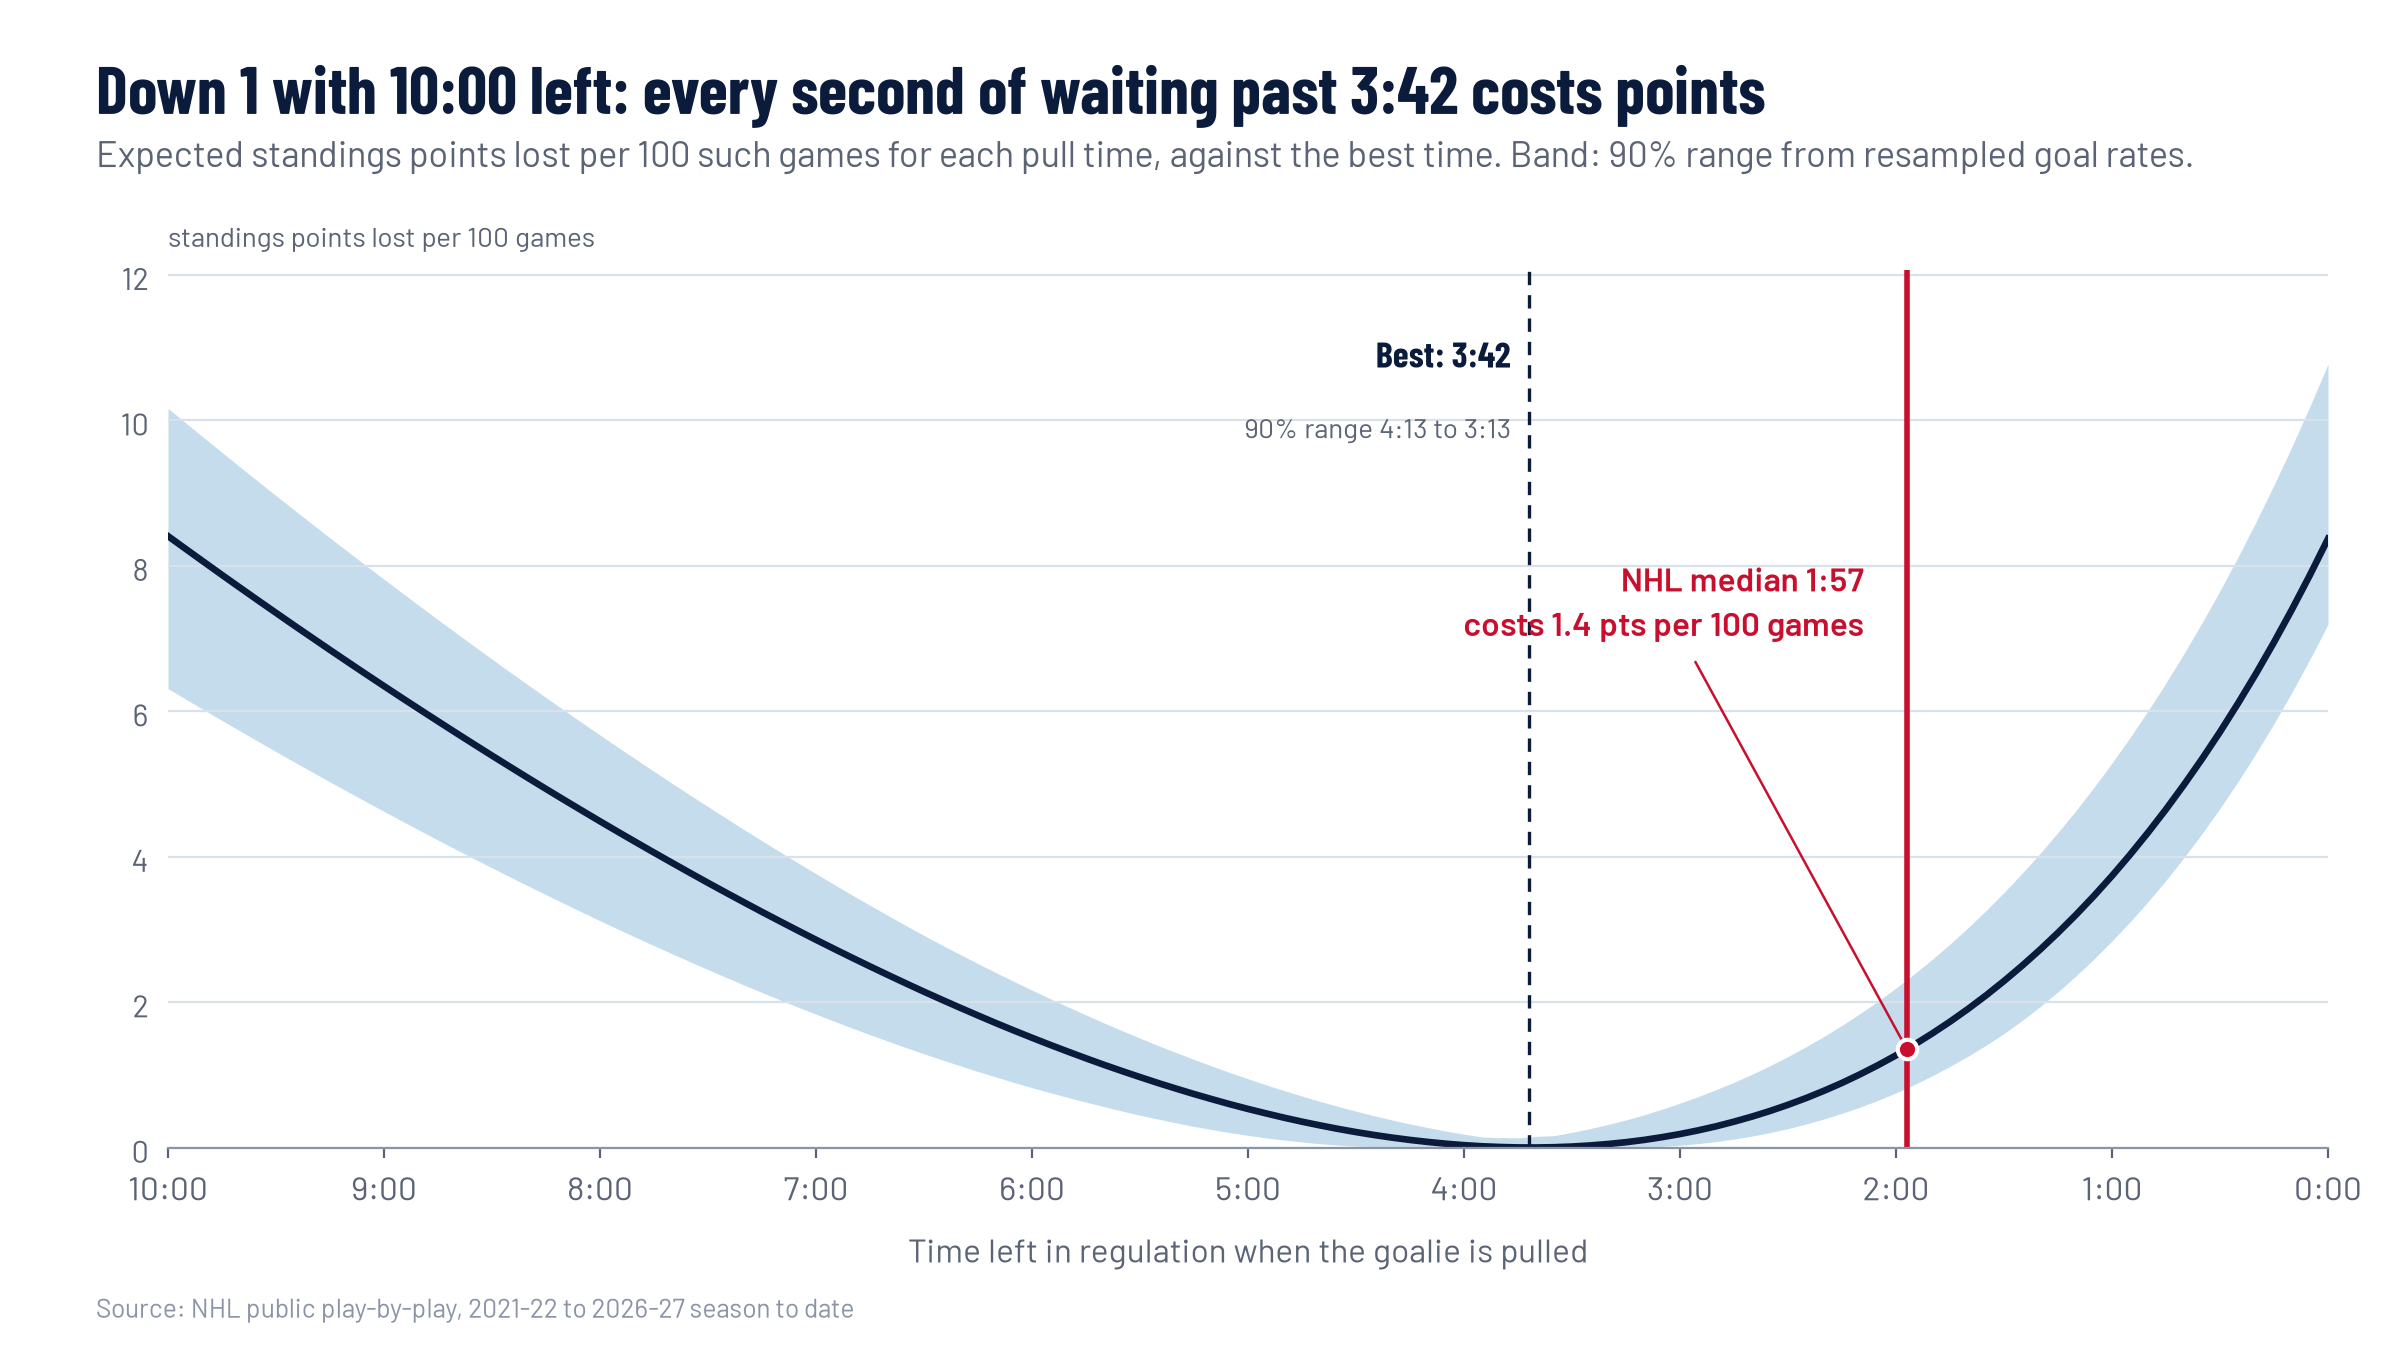
U-shaped curve of standings points lost per 100 games by goalie pull time when trailing by one with 10:00 left, with a 90% uncertainty band. The minimum is at 3:42 left (90% range 4:13 to 3:13). The NHL median pull at 1:57 costs about 1.4 points per 100 games.
Cost of each pull time when down 1 with 10:00 left. Waiting until the NHL median costs about 1.4 standings points per 100 such games compared with the best time.
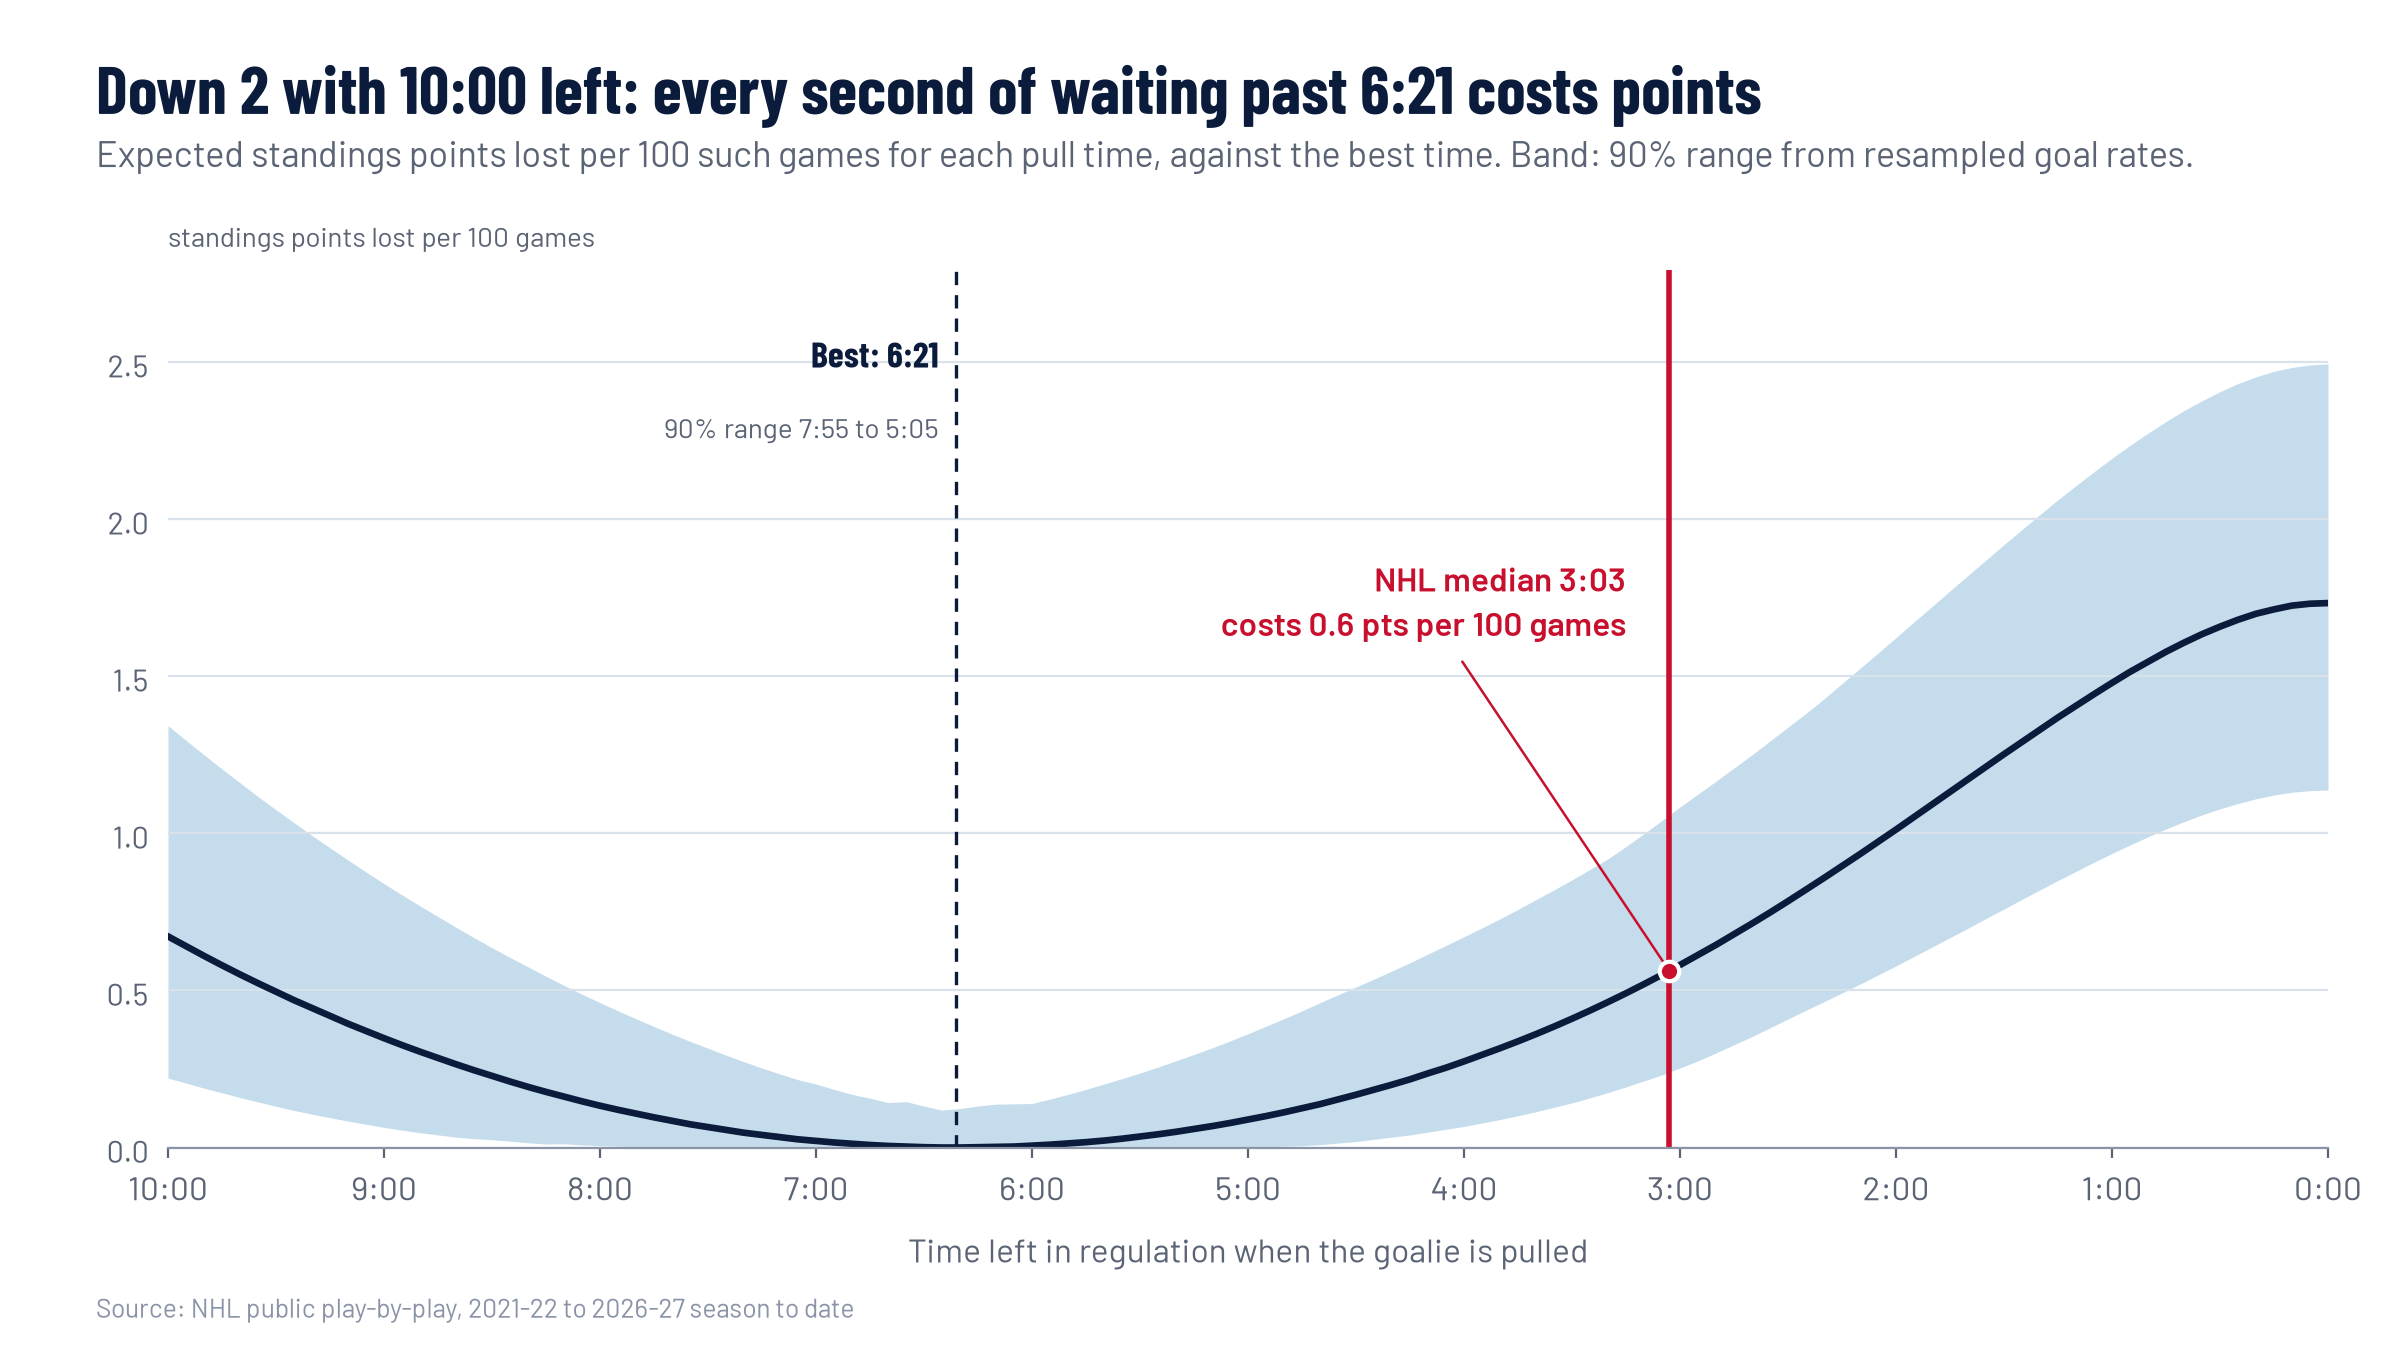
U-shaped curve of standings points lost per 100 games by goalie pull time when trailing by two with 10:00 left, with a 90% uncertainty band. The minimum is at 6:21 left (90% range 7:55 to 5:05). The NHL median pull at 3:03 costs about 0.6 points per 100 games.
Down 2 the curve is flatter but the best time is much earlier, a little over six minutes.
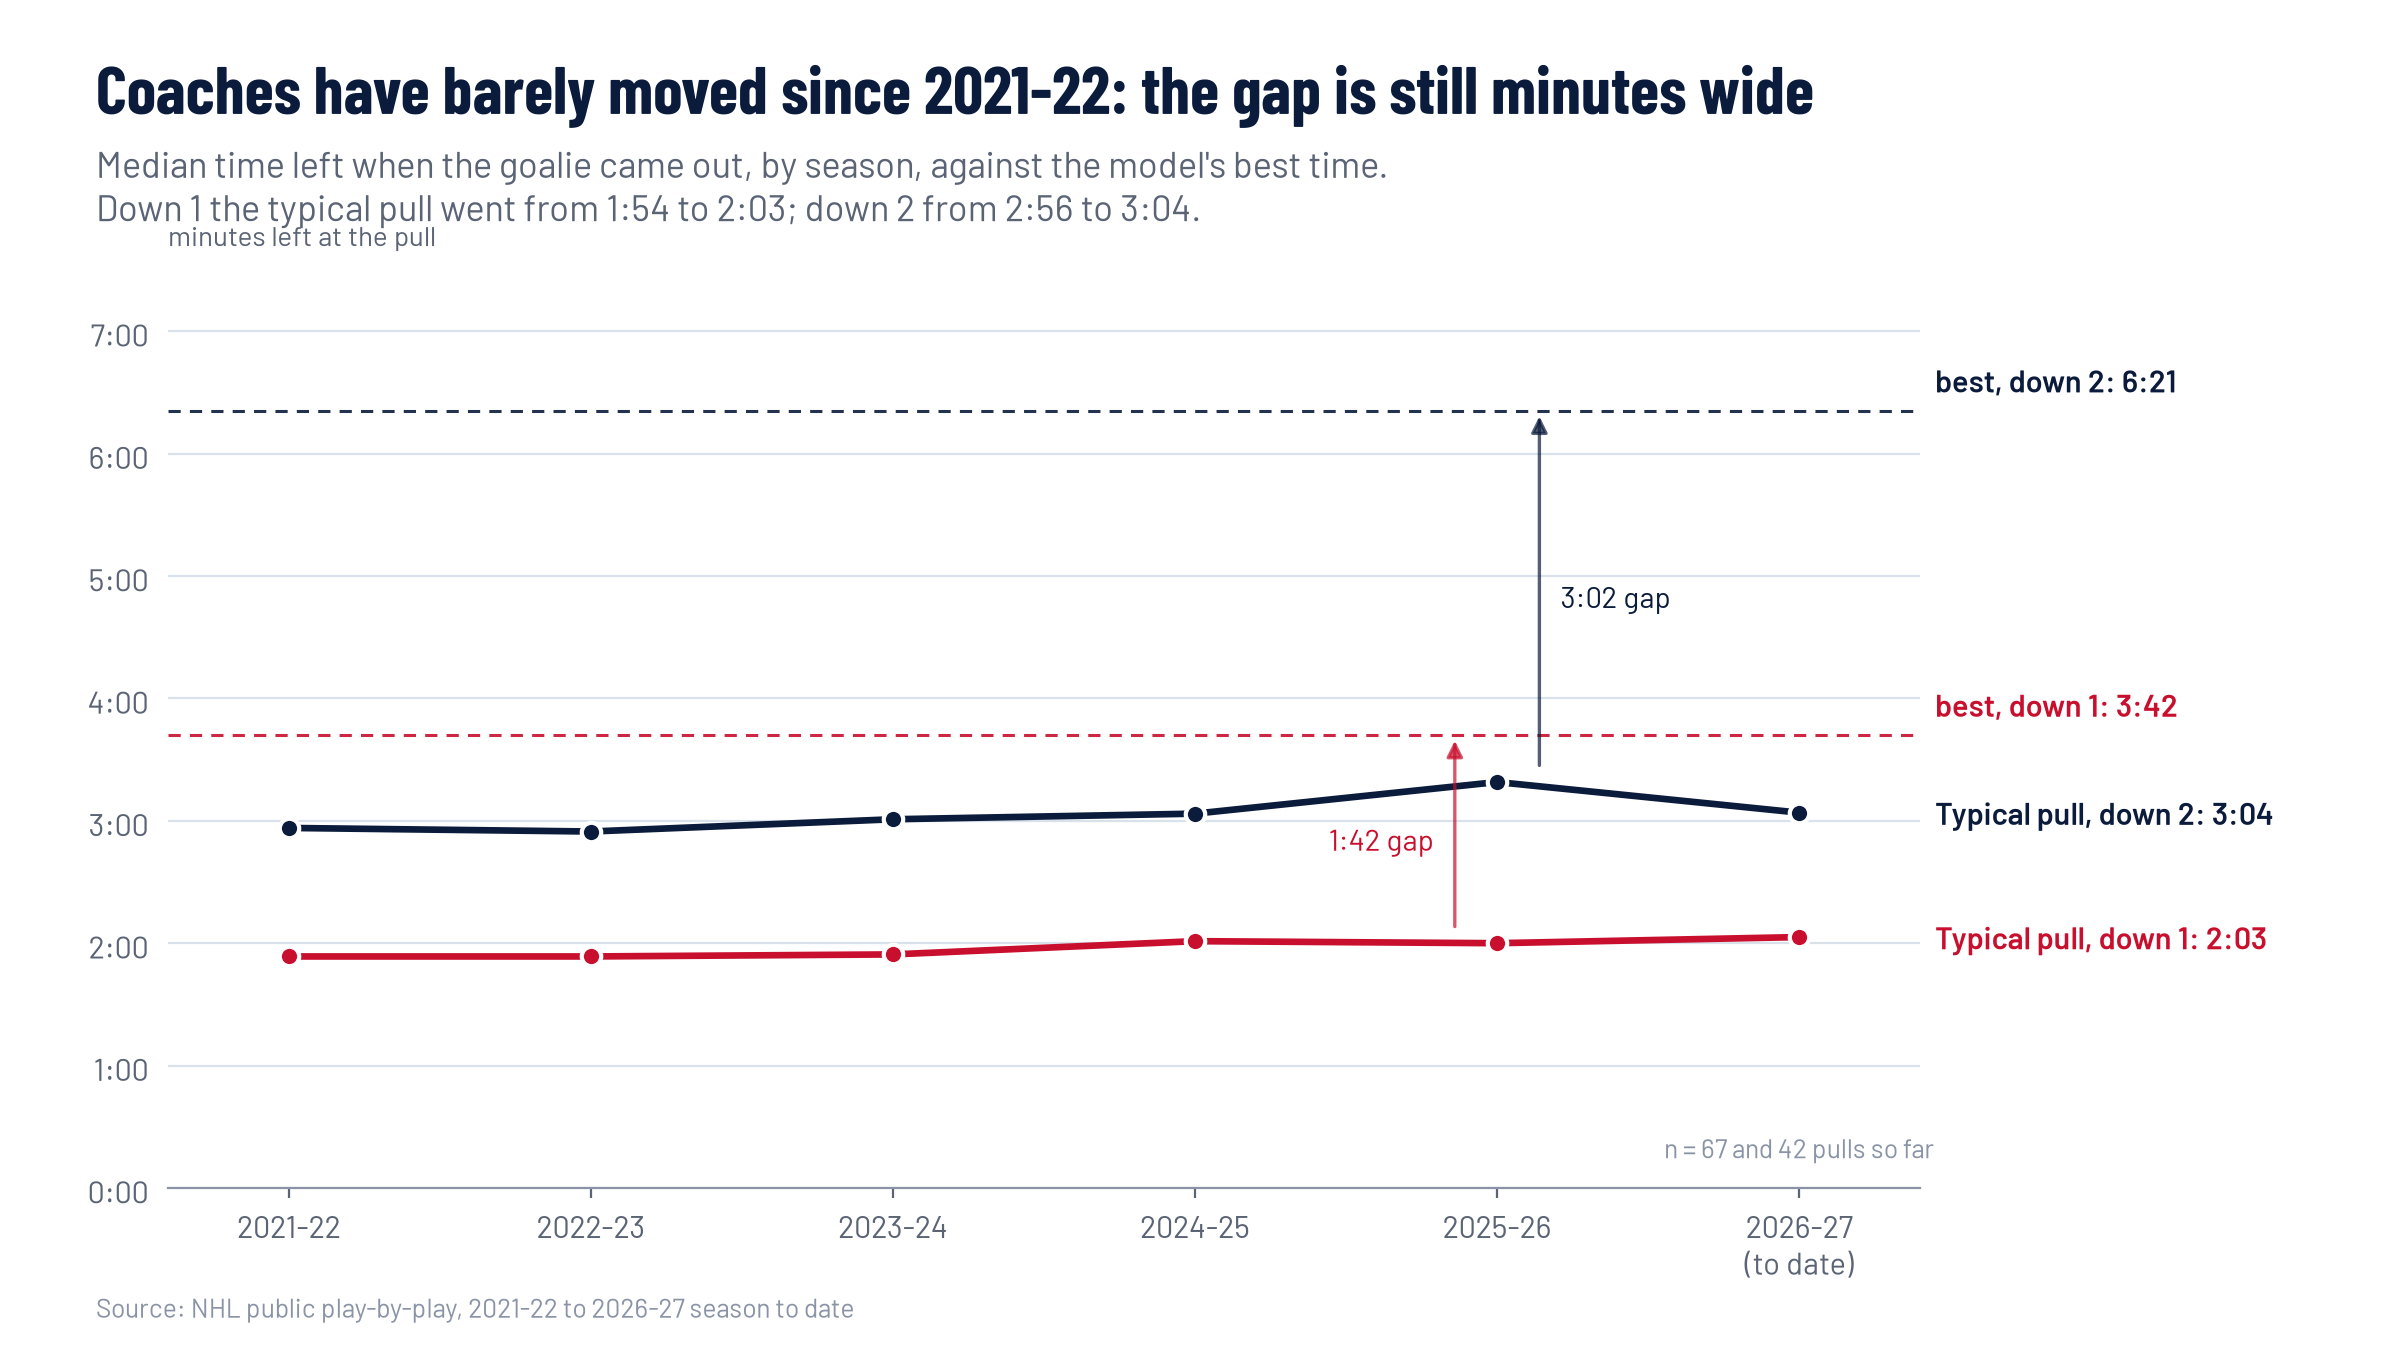
Line chart of the NHL median goalie pull time by season from 2021-22 to 2026-27. Down one it moved from 1:54 to 2:03 against a best time of 3:42; down two from 2:56 to 3:04 against 6:21. The last season is partial.
Coaches have moved about ten seconds earlier since 2021. The gap to the best time is still close to two minutes when down 1 and over three when down 2.

Does it hold up on games it never saw?

I fit every goal rate on 2021-22 through 2024-25 only, then scored the model on every 2025-26 and 2026-27 game where a team trailed by one or two goals at eight checkpoints in the last ten minutes. The model never sees outcomes; it only knows goal rates, the clock and when that team actually pulled.
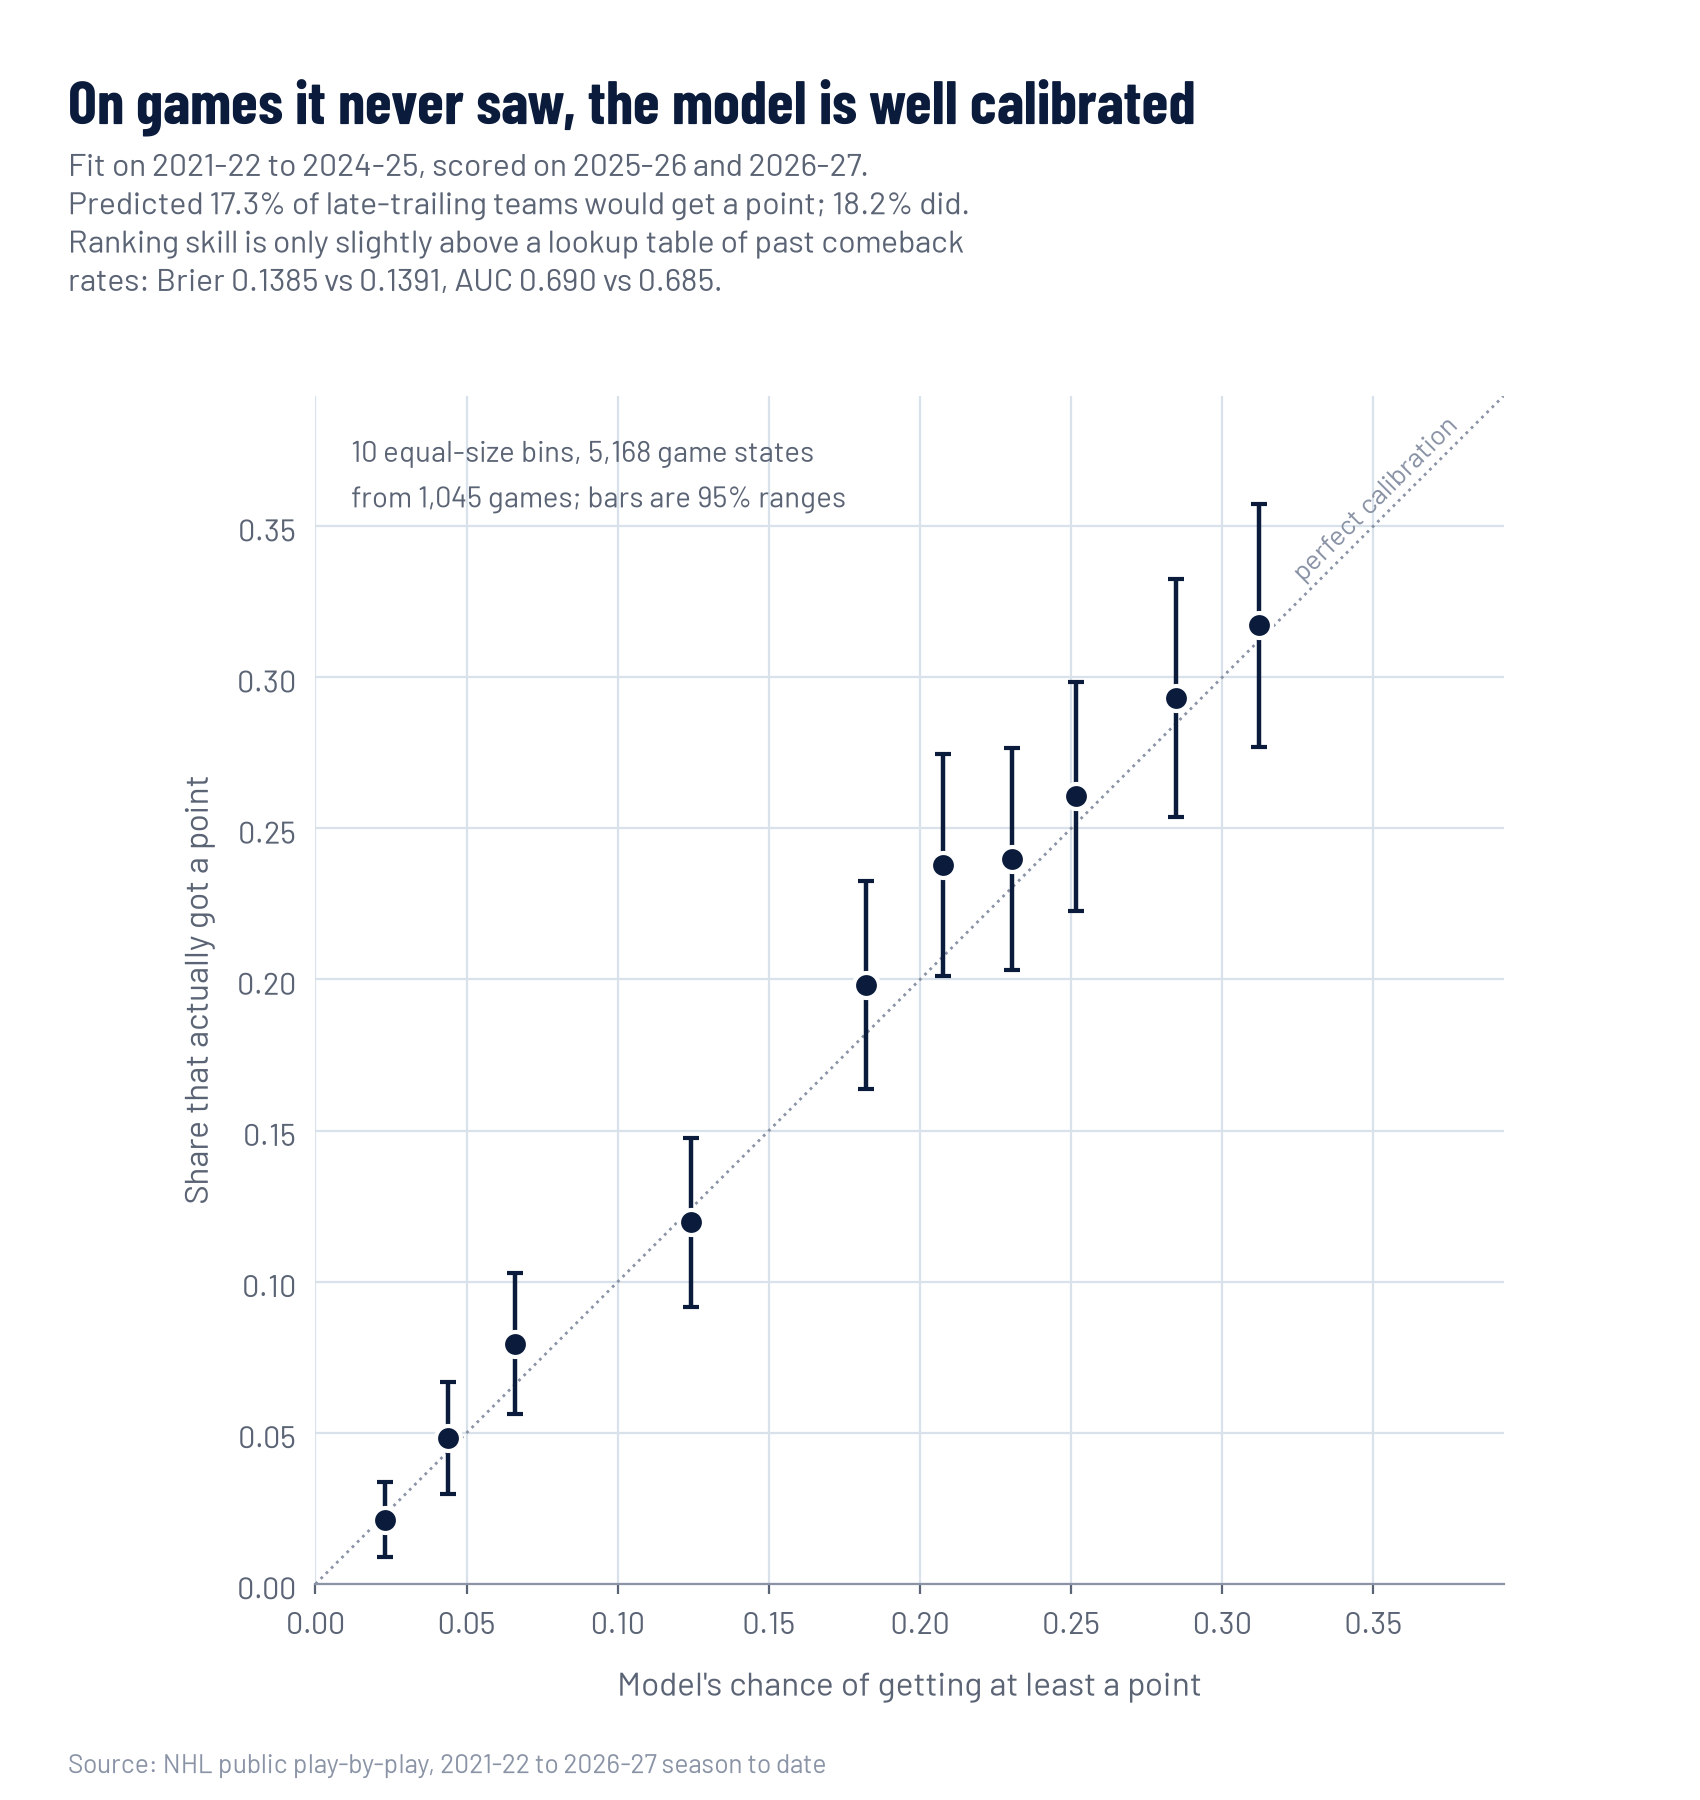
Calibration plot of predicted against observed chance of getting at least a point, 10 bins with 95% ranges, all close to the diagonal from 0.02 to 0.31. Fit on 2021-22 to 2024-25, tested on 2025-26 and 2026-27. Predicted 17.3%, observed 18.2%. Brier 0.1385 against a baseline of 0.1391; AUC 0.690 against 0.685.
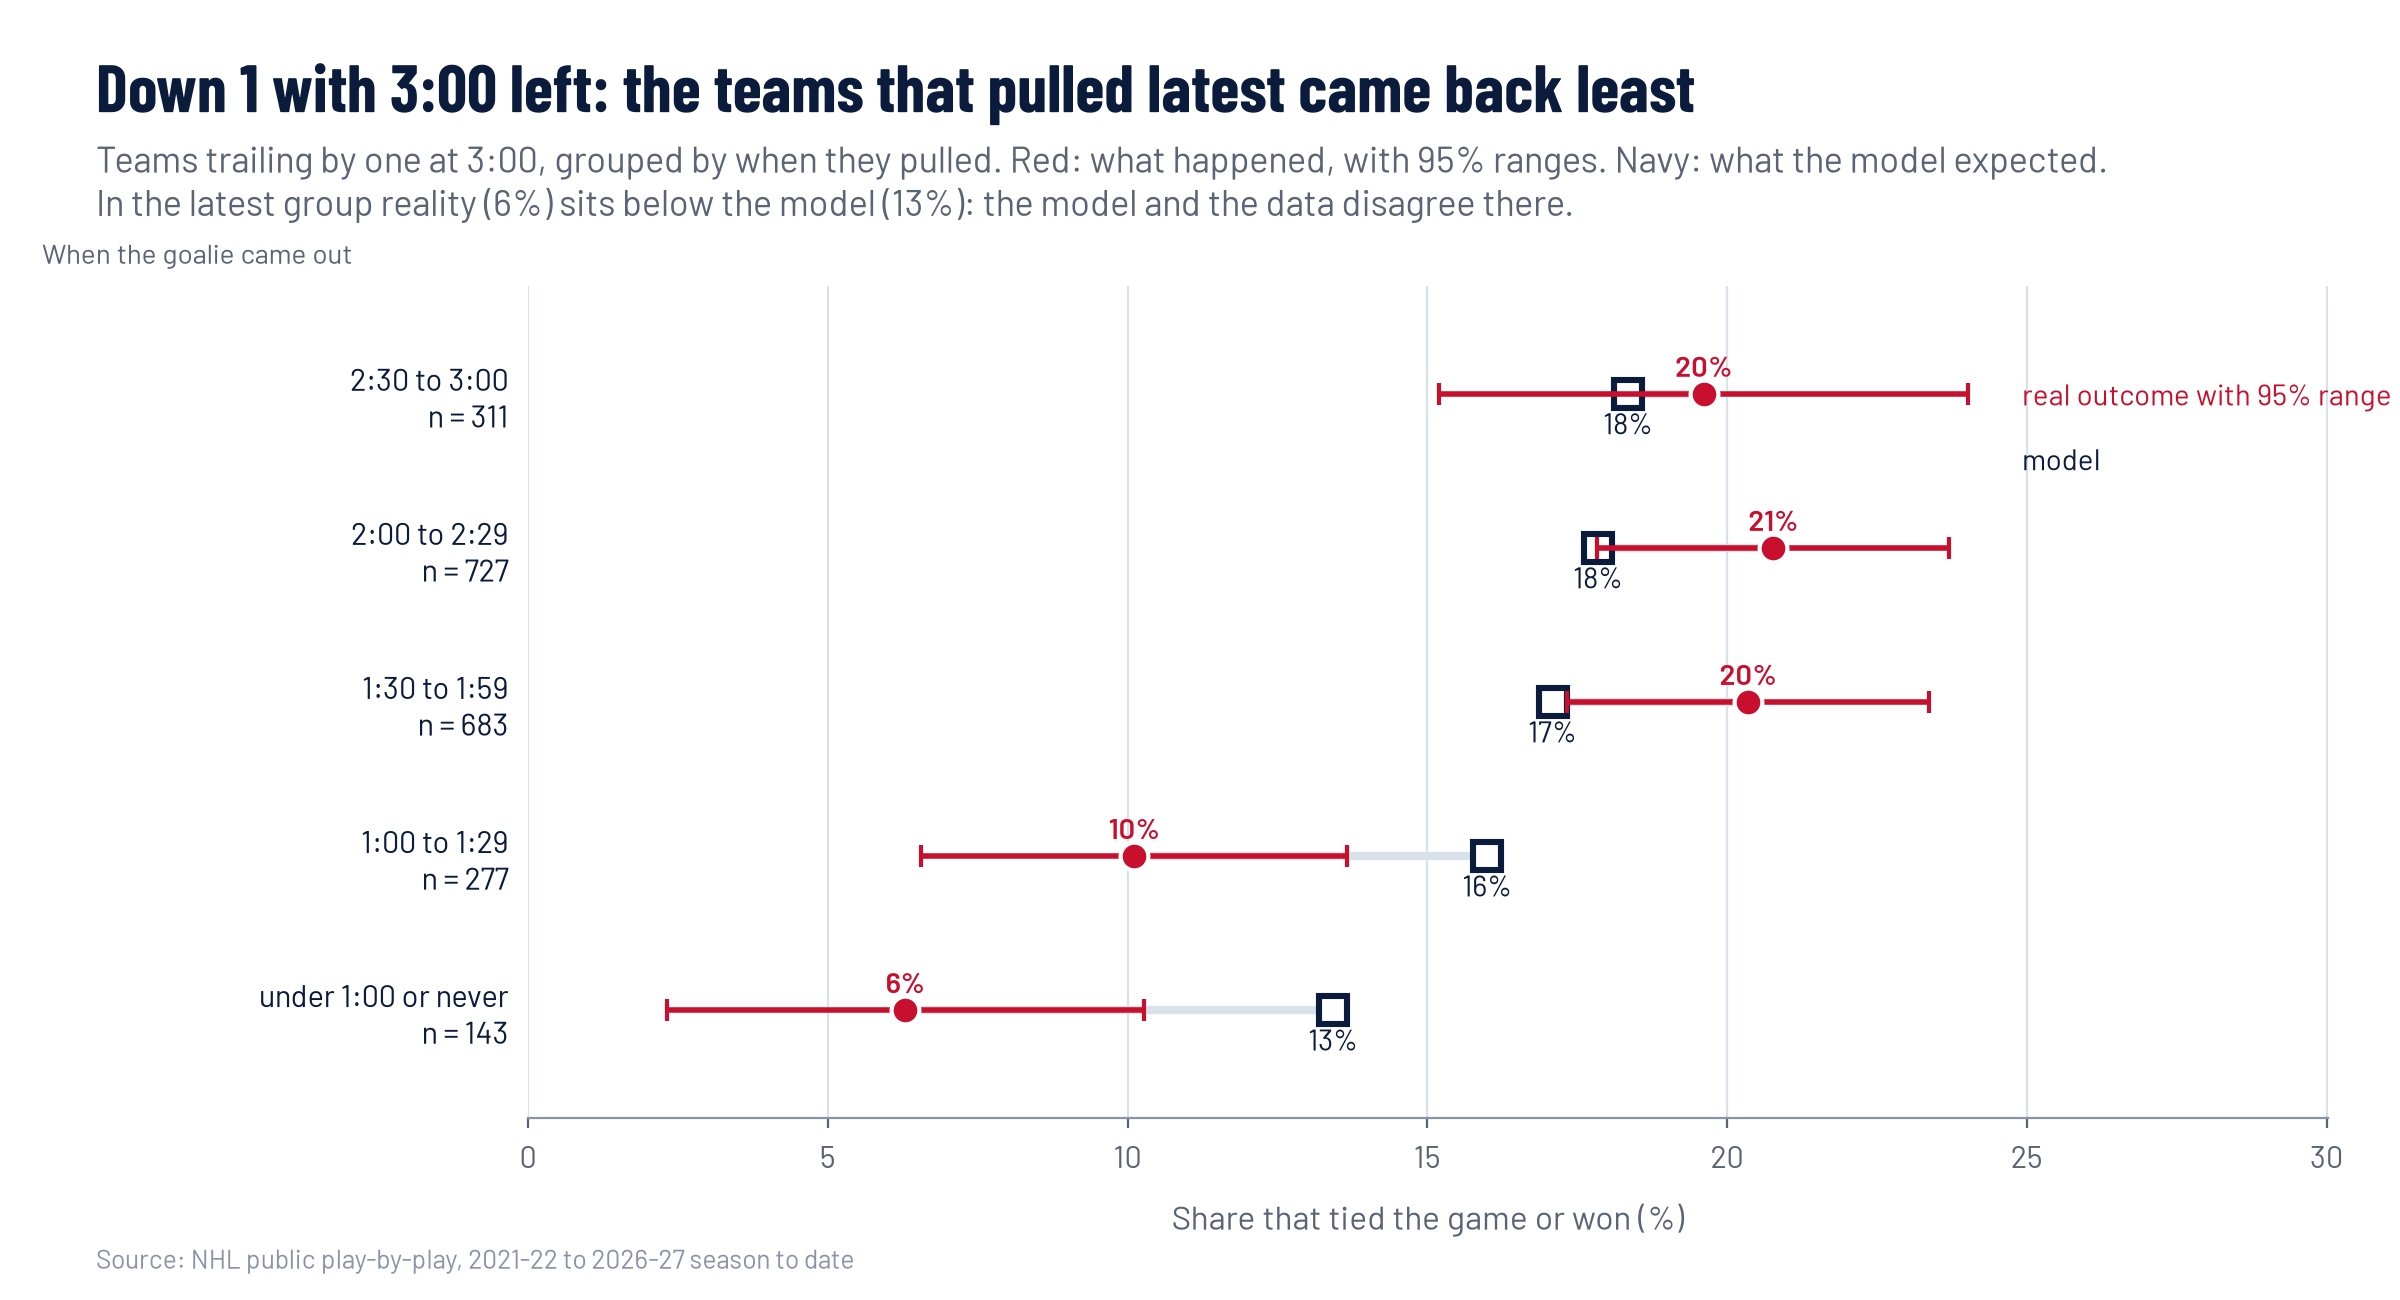
Dot plot of the share of teams trailing by one with 3:00 left that tied or won, grouped by when the goalie came out, with 95% ranges, against the model's expectation. 2:30 to 3:00: 20% real, 18% model, n=311. 2:00 to 2:29: 21% real, 18% model, n=727. 1:30 to 1:59: 20% real, 17% model, n=683. 1:00 to 1:29: 10% real, 16% model, n=277. under 1:00 or never: 6% real, 13% model, n=143.
Real comeback rate for teams down 1 with 3:00 left, grouped by when they pulled. Teams that waited past 1:30 tied the game about half as often. Part of the lowest bar is teams that could not pull because they were short handed.

Every team

Team specific best times use each club's own 6 on 5 goals for and against from , blended with the league rate because a team only plays well under an hour a season at 6 on 5. Treat team differences as a nudge, not a verdict. Click a heading to sort.
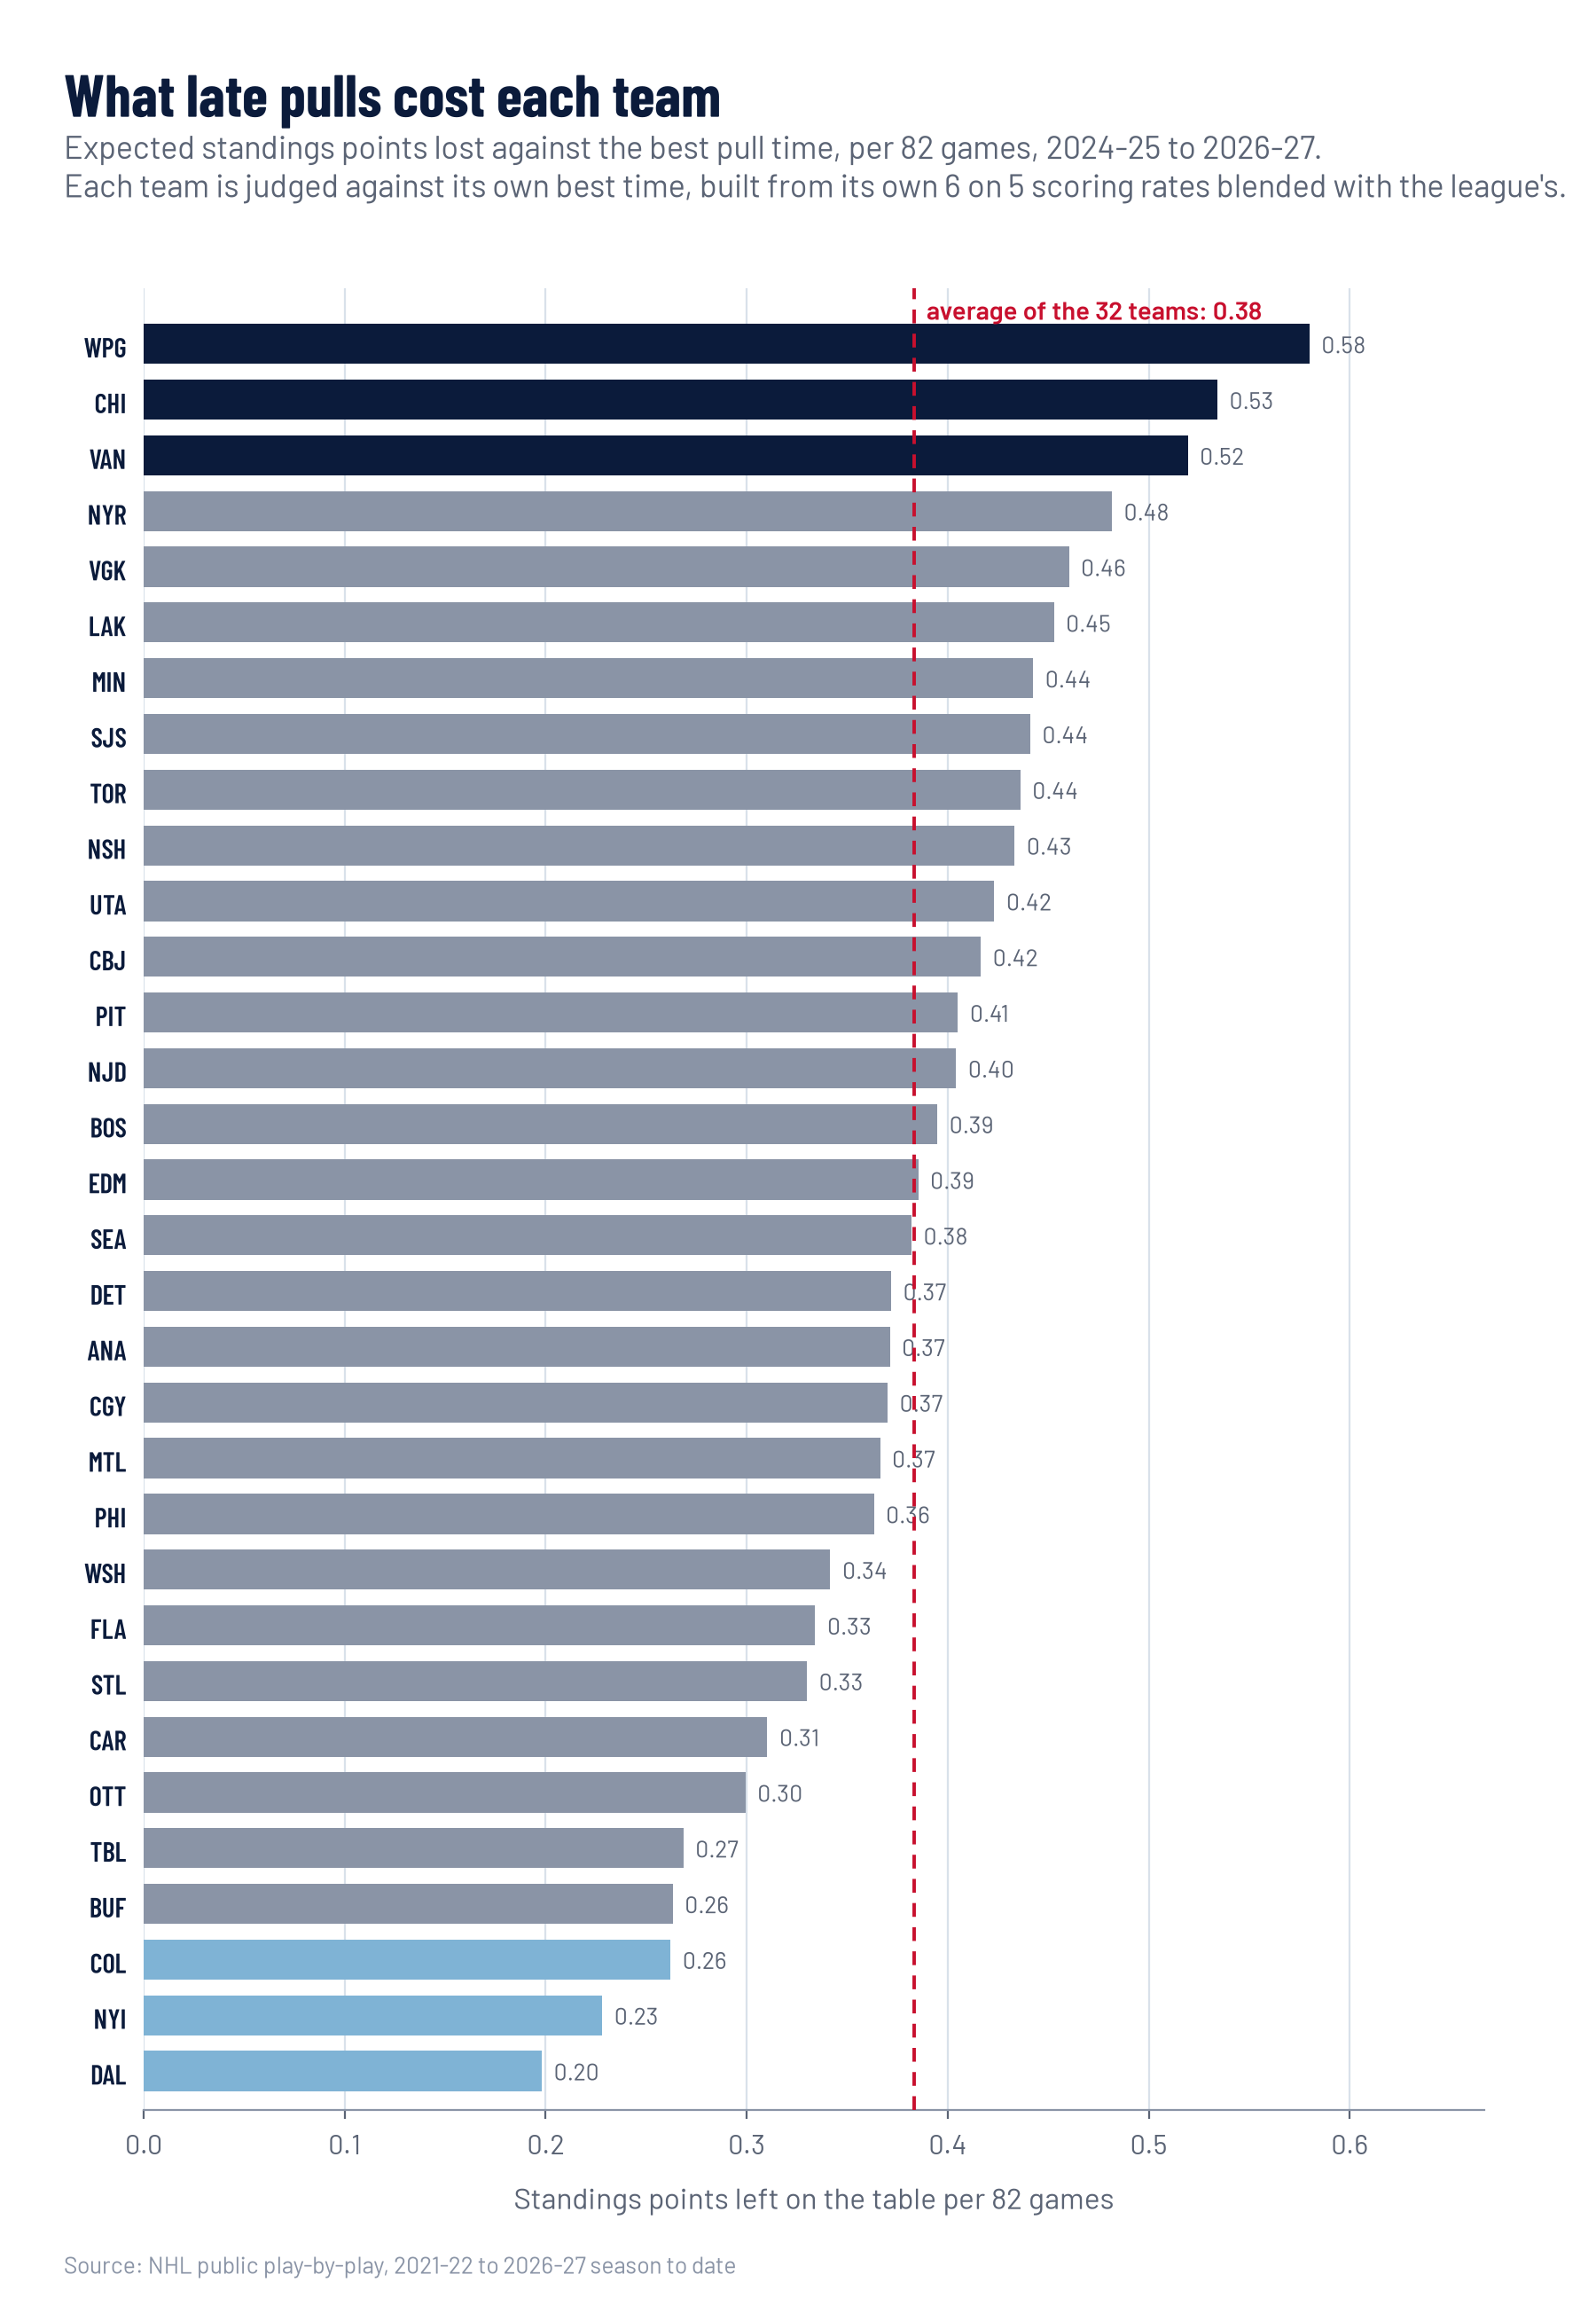
Horizontal bar chart ranking all 32 NHL teams by standings points lost to late goalie pulls per 82 games, 2024-25 to 2026-27. WPG loses the most at 0.58, DAL the least at 0.20; the league average is 0.38.
Points left on the table per 82 games, judged against each team's own best time. The table below has the details.

How it works

  1. Data. Every regular season game from 2021-22 to today from the NHL's public feed (api-web.nhle.com). Each event carries a situation code that says how many skaters and goalies each side has, so I can see the exact moment a goalie leaves.
  2. Clean pulls. Delayed penalty extra attackers look like pulls in the data. Any goalie out stretch that ends with a penalty on the other team within 75 seconds is removed.
  3. Goal rates. Third period goals for and against per 60 minutes, split by score and by whether the goalie is in or out. Pulling down 1 lifts a team's scoring from 2.5 to 6.9 goals per 60, while goals against jump from 2.1 to 20.3.
  4. Model. A second by second Markov chain over the score and the clock, solved backwards from the final horn. In the regular season a tie is worth a point plus a coin flip in overtime, so it optimises standings points; the playoff mode optimises win chance.
  5. Uncertainty. 400 draws of every goal rate from its posterior, re solved each time, give the 90% range on the best pull time.
  6. Backtest and cost. Out of sample calibration as above, then each real decision is priced as points lost versus the best policy from that exact moment.
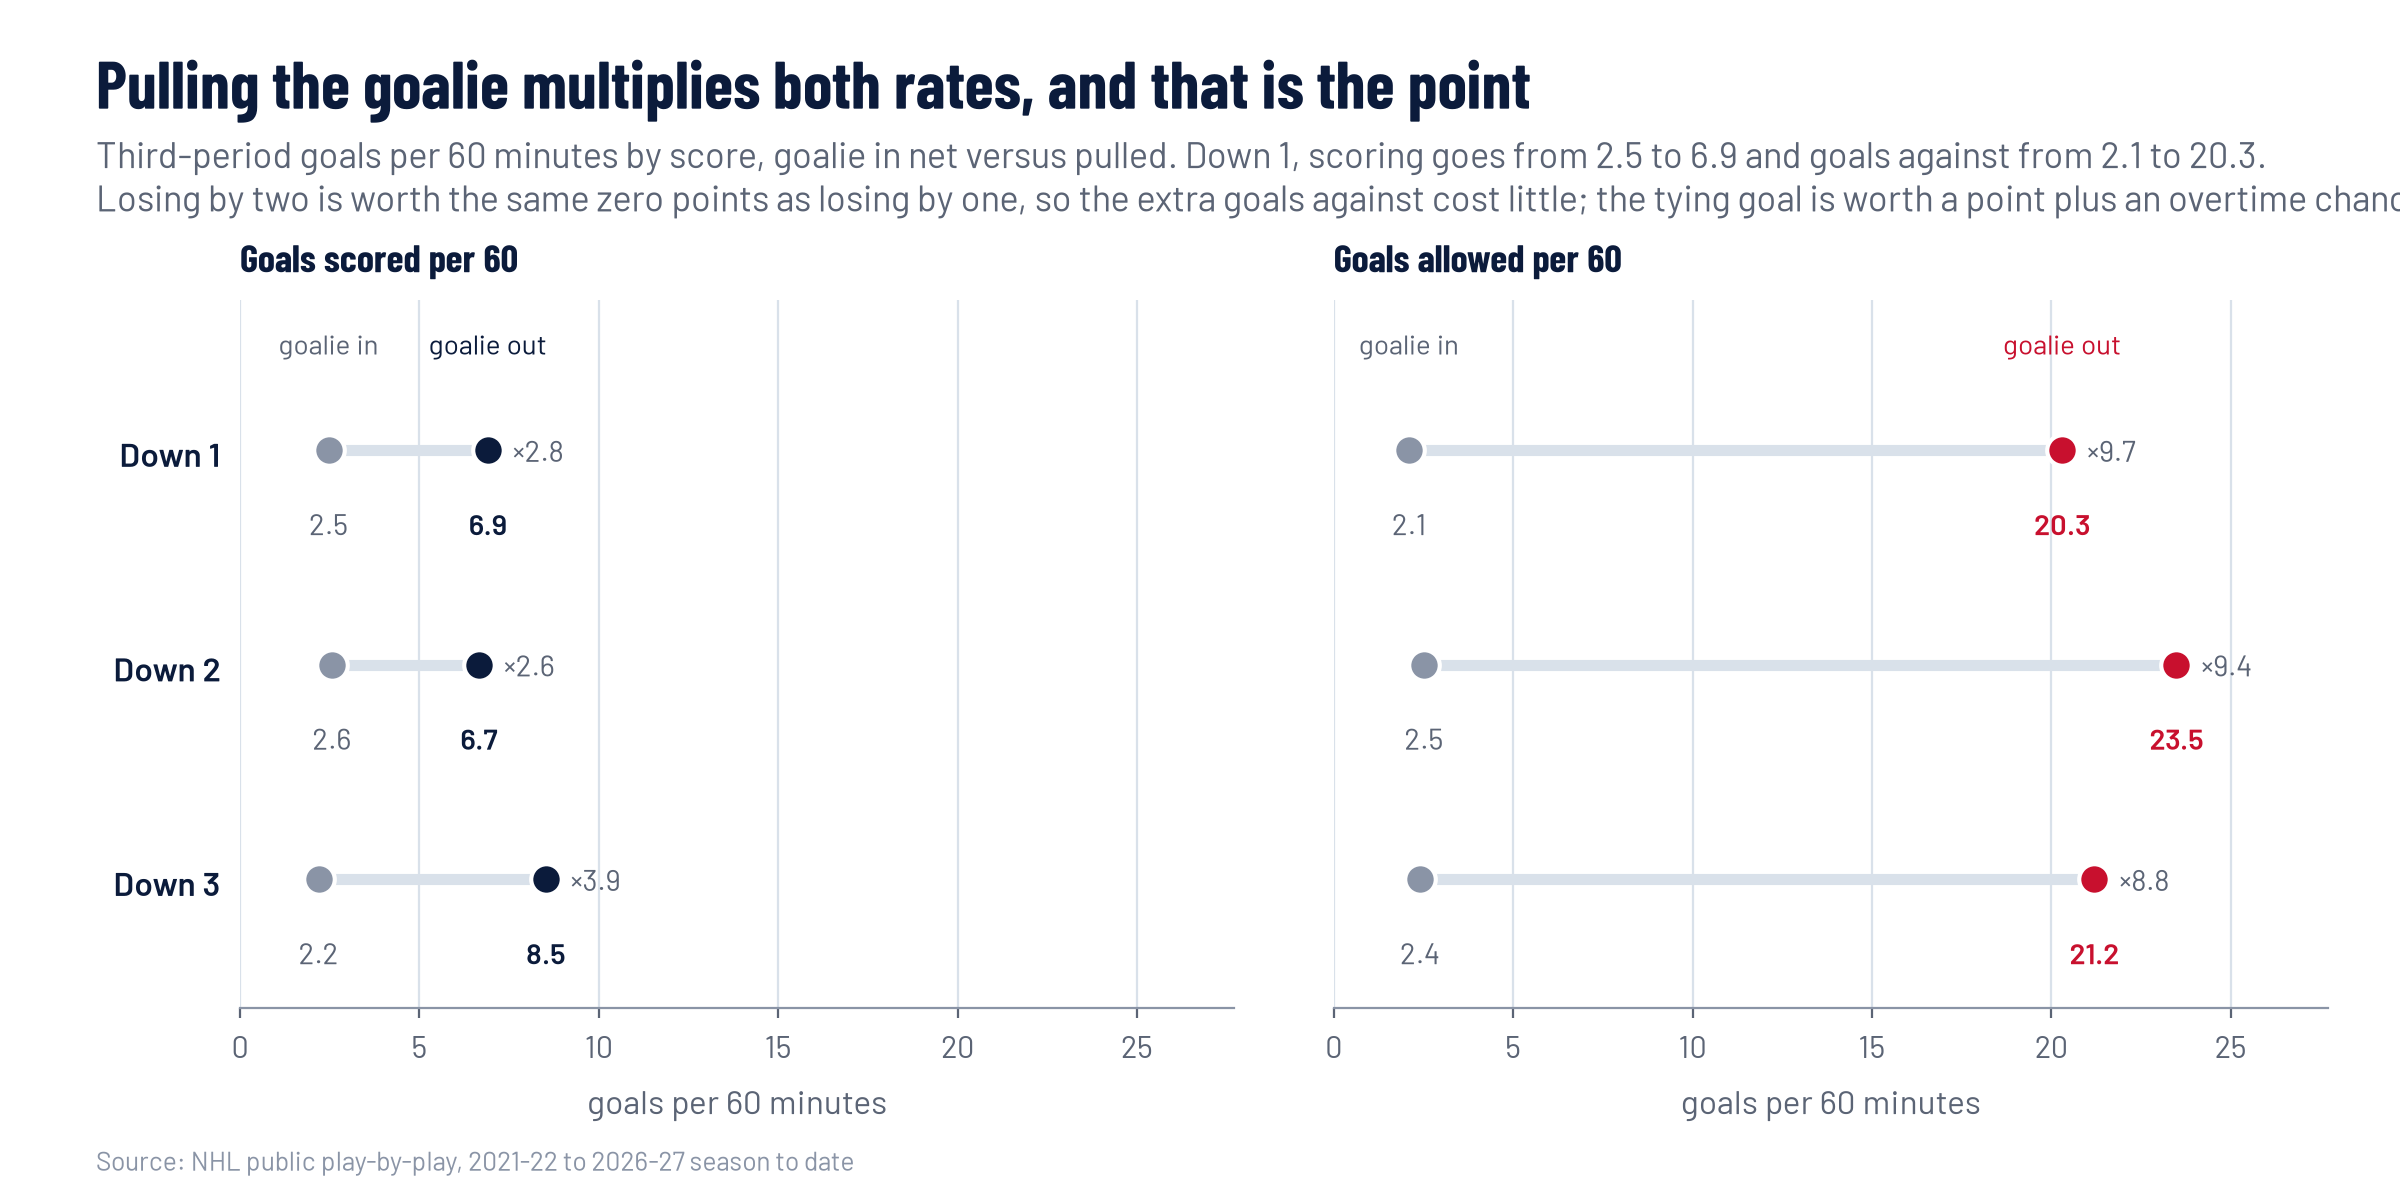
Two dumbbell charts of third-period goals scored and allowed per 60 minutes with the goalie in net versus pulled, for teams trailing by one, two and three. Down 1: scored 2.5 to 6.9, allowed 2.1 to 20.3. Down 2: scored 2.6 to 6.7, allowed 2.5 to 23.5. Down 3: scored 2.2 to 8.5, allowed 2.4 to 21.2.
Pulling the goalie roughly triples a trailing team's scoring rate and multiplies goals against by about nine. It still pays, because a bigger loss costs nothing extra in the standings.

Robustness

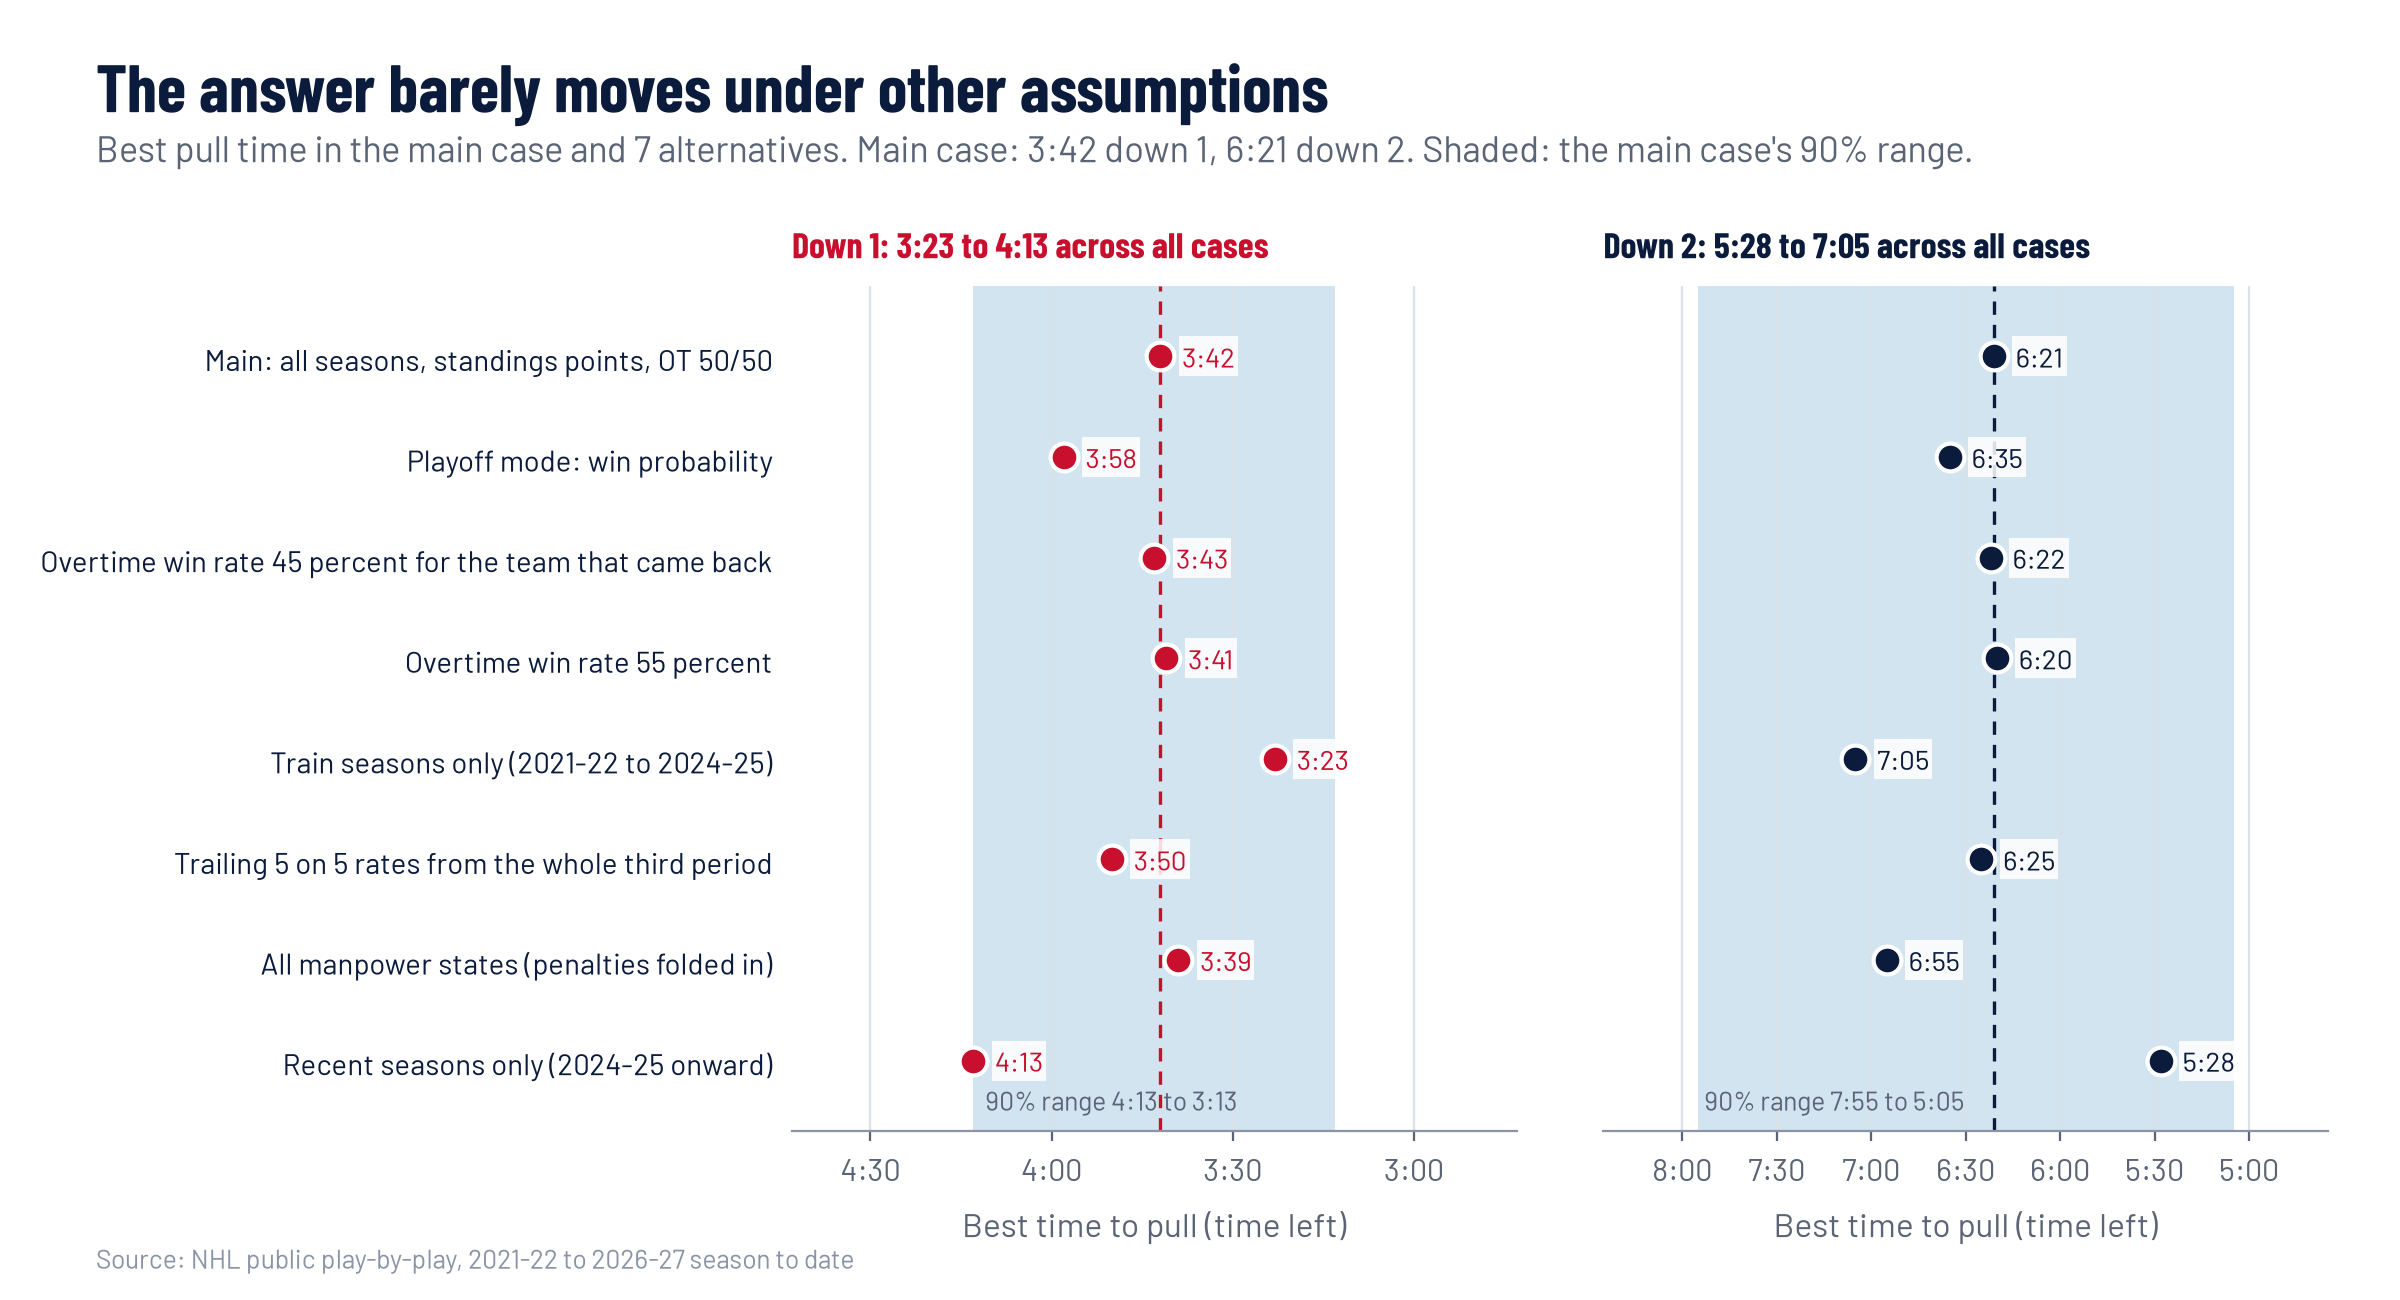
Dot plot of the best goalie pull time in the main case and 7 alternative assumptions. Down one it stays between 3:23 and 4:13; down two between 5:28 and 7:05. Cases: Main: all seasons, standings points, OT 50/50: 3:42 and 6:21; Playoff mode: win probability: 3:58 and 6:35; Overtime win rate 45 percent for the team that came back: 3:43 and 6:22; Overtime win rate 55 percent: 3:41 and 6:20; Train seasons only (2021-22 to 2024-25): 3:23 and 7:05; Trailing 5 on 5 rates from the whole third period: 3:50 and 6:25; All manpower states (penalties folded in): 3:39 and 6:55; Recent seasons only (2024-25 onward): 4:13 and 5:28.
Under every setting tested, the best time down 1 stays between 3:23 and 4:13 left.

Limits

The model treats both teams as league average unless you pick a team, ignores which zone the faceoff is in, and assumes the coach can pull at any second. Real coaches wait for possession or an offensive zone draw, which is one reason to start looking for the moment a little before the best time, not after it.